
A good ROAS is the one your margin sets
Everyone quotes a target ROAS and nobody agrees. The number you need depends on your own contribution margin, and you can work it out in ten minutes.
Someone on a podcast says 4x is the number to beat. A competitor says they are growing happily at 1.8x. Both can be telling the truth, because ROAS on its own says nothing about whether money was made. The only target worth having is the one your own margin produces.
Why an industry-average ROAS cannot help you
Two stores selling the same product at the same price can need completely different returns. One manufactures at 30% of retail and ships free from a local warehouse. The other buys wholesale at 70% of retail, pays international freight and absorbs a 20% return rate. An “industry benchmark” averages those two together and gives you a number that is wrong for both.
Worse, most quoted benchmarks do not say which ROAS they mean. Platform-reported? Blended? First order or lifetime? Before or after returns? You cannot compare your number to someone else’s unless you know all four, and you almost never do. Work out your own and stop reading other people’s.
The break-even ROAS formula
Break-even ROAS = 1 ÷ gross margin, expressed as a decimal.
If you sell at £100 and the product costs you £40 landed, your gross margin is 60%, or 0.60. One divided by 0.60 is 1.67. Every pound of ad spend must bring back £1.67 of revenue before advertising starts costing you money.
Change the margin and everything changes. At a 25% margin the same sum gives 1 ÷ 0.25 = 4.0. The brand with the 60% margin can pay four times as much per sale as the brand with the 25% margin and still be in profit.
Break-even is not the goal, though. It is the floor. To keep a set share of revenue as contribution, the formula becomes:
Target ROAS = 1 ÷ (margin − the share of revenue you want to keep)
Break-even ROAS by gross margin
| Gross margin | Break-even ROAS | ROAS to keep 10% of revenue |
|---|---|---|
| 20% | 5.00x | 10.00x |
| 25% | 4.00x | 6.67x |
| 30% | 3.33x | 5.00x |
| 40% | 2.50x | 3.33x |
| 50% | 2.00x | 2.50x |
| 60% | 1.67x | 2.00x |
| 70% | 1.43x | 1.67x |
| 80% | 1.25x | 1.43x |
Find your row, and that is your line in the sand. Note how brutal the right-hand column gets at low margins: a 20%-margin business needs a 10x return to keep a tenth of its revenue, which is why thin-margin resellers usually have to fix pricing or basket size before they fix campaigns.
Use contribution margin, not gross margin
Gross margin flatters you because it only counts the cost of goods. The number that decides whether an ad is worth running is contribution margin: what is left of an order after every cost that exists because that order exists.
Subtract all of these per order:
- Cost of goods, including inbound freight and duty.
- Payment processing. Check your own statement rather than guessing; most gateways charge a percentage plus a fixed fee per transaction.
- Pick, pack and the shipping you subsidise.
- Returns: your return rate multiplied by what a return actually costs you (outbound and inbound postage, plus any stock you cannot resell).
- Discount codes and sitewide promotions, averaged across orders.
- Affiliate or marketplace commission, and any per-order app fees.
Leave out salaries, rent, software and your agency fee. Those are paid out of contribution, not deducted before it.
Take a £100 order with a £35 product cost. Gross margin is 65%, so break-even looks like 1.54x. Now add £6 of fulfilment, £3.20 of payment fees, a £1.44 returns allowance and £5 of average discount. Contribution is £49.36, the margin is 49.4%, and break-even is 2.03x. The same account just moved from “scale it” to “barely washing its face” without a single campaign changing.
Why 2x is profitable for one business and ruinous for another
A digital product with a 90% contribution margin breaks even at 1.11x. At 2x it keeps £40 of every £100 of revenue, and the owner should be looking for more spend, not a better ROAS.
A reseller on an 18% contribution margin breaks even at 5.6x. At 2x, each £100 of revenue costs £50 in ads and returns £18 of contribution, so the campaign destroys £32 per £100 of revenue. It will look like growth in the revenue chart for exactly as long as the cash lasts.
This is also why ROAS is the wrong frame for lead generation. If you sell services, chain the numbers instead: cost per qualified lead, the share of qualified leads that close, and gross profit per closed sale. A £40 lead that closes one in five at £900 of gross profit is a 4.5x return on spend, whatever Ads Manager chooses to display. If your ads are producing traffic but nothing downstream, the problem is usually further along the chain, which is what we cover in why Meta ads get clicks but no sales.
Blended ROAS versus what the platform reports
Platform ROAS is the revenue each platform believes it caused, divided by what you spent there. It includes view-through and multi-day click windows, and Meta and Google will both claim the same order. Add their reported revenue together and it can comfortably exceed what your store actually took.
Blended ROAS is total store revenue divided by total ad spend across every platform, for the same date range, taken from your store’s own reports. It cannot be double-counted and it is the only one your bank balance recognises. Some teams call the same ratio MER.
The working rule we give clients:
- Decide total budget on blended ROAS. If blended sits below break-even, reduce spend regardless of what the platforms claim.
- Decide budget splits on platform ROAS. It is a reasonable relative signal between two campaigns in the same account on the same day.
- Watch new-customer ROAS separately. New-customer revenue divided by total ad spend tells you whether paid media is buying growth or being paid to re-sell to your existing list.
None of that works on broken measurement. If your Pixel, GA4 and store have never agreed, start with a tracking and analytics rebuild before you start setting targets, because both of these numbers are only as good as the events behind them.
Why first-order ROAS misleads when people reorder
If a customer typically buys again, judging acquisition on the first order alone sets your target too high and caps your growth.
Pull revenue per acquired customer at 90 days from your store’s cohort report. If 100 new customers produce £140 of revenue for every £100 they spent on their first order, your repeat multiple is 1.4. Divide break-even by it: a 2.0x break-even becomes a 1.43x first-order target.
Two honest cautions. Use a window you can actually fund, because a 1.43x target means paying for stock now and collecting the margin in three months. And do not stretch the window until the maths works; if you need 24 months of repeat purchase to justify a campaign, the campaign does not work.
The range we actually see
Live accounts spread far wider than any benchmark admits. A footwear retailer reached 16x on Google Shopping after a feed rebuild, because high-intent shopping traffic for a known product is about as efficient as paid media gets. A French fashion store moved to 10.3x ROAS with cost per purchase down 49% in a month. A US apparel brand scaled to a $26.8K daily budget at 389% blended ROAS, where the point is not the ratio but that it held as the daily budget went from $3K to $26.8K.
Those are illustrations of range, not promises. What moved each of them was usually supply of new angles rather than a bid setting, which is why AI UGC ads have become the cheapest way to defend a ROAS target while spend grows. Read them as proof that the right target depends on the offer, the margin and the stage, and that a smaller ROAS at much larger volume is often the better business, which is exactly the trade in scaling volume 4x at the same ROAS.
What this looks like when we do it
Before we touch a campaign we build the margin model with the client: contribution per order, break-even ROAS, a target ROAS that leaves a stated share of revenue, and a blended figure on one dashboard next to spend and cost per result. Then we scale towards the target rather than towards a number someone read online. That is the groundwork behind results like the 389% blended ROAS apparel account, where knowing the floor was what made a $3K to $26.8K daily budget decision safe to take.
Your next step
Work out two numbers this week: your contribution margin per order and your blended ROAS for last month. If blended is above break-even, your constraint is volume, and how much to spend on ads is the next question. If it is below, more spend will only lose money faster, and the fix is margin, offer or conversion rate first. If you would like someone to check the maths and the tracking behind it, our paid media team does exactly that in the free audit, and you keep the one-page plan either way.
Common questions
What is a good ROAS for e-commerce?
There is no single figure. Divide 1 by your contribution margin to get break-even: a store keeping 50p of every pound breaks even at 2x, while one keeping 25p needs 4x. Anything above your break-even is profitable on that revenue, anything below it is buying sales at a loss.
Is a 2x ROAS good?
It depends entirely on margin. At a 60% contribution margin, 2x leaves you 20p of profit per pound of revenue. At a 20% contribution margin, 2x loses you 30p per pound. Work out your own break-even before judging the number.
Why is my Shopify revenue lower than my Meta ROAS suggests?
Platforms count conversions they influenced, including view-through and cross-platform overlap, so Meta and Google together often claim more revenue than your store recorded. Compare total store revenue against total ad spend for the same period, and treat platform ROAS as a relative signal only.
Should I use LTV to set my ROAS target?
Only if you can measure repeat purchase and fund the gap. Pull 90-day revenue per acquired customer from your store's cohort report, divide your break-even ROAS by the repeat multiple, and keep enough cash to cover the months between the first order and the second.
Proof from our work
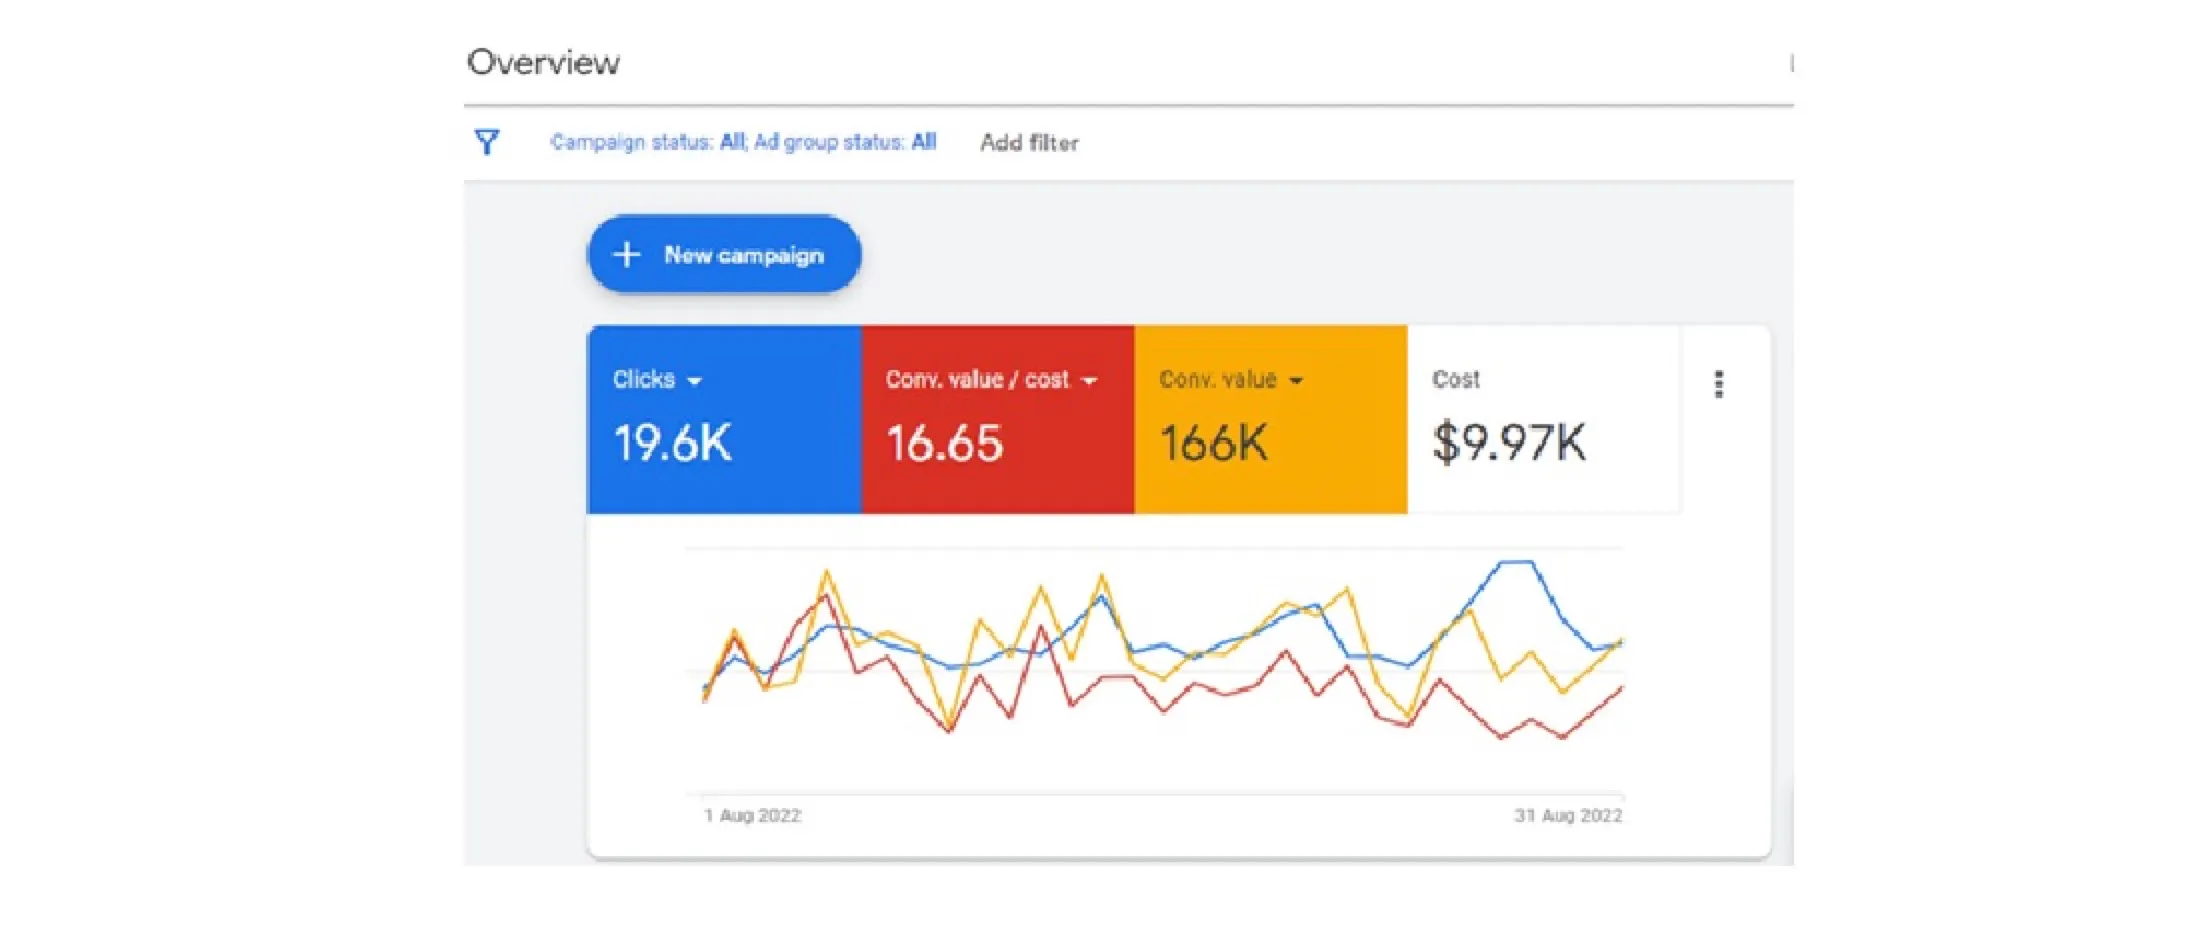
Conversion value per $1 of Google Ads spend
A footwear retailer came to us with Google Ads campaigns that were underperforming because the Shopping feed was never set up properly. We rebuilt the feed, added display remarketing and Performance Max, and tested the checkout. The account now returns $16.65 in sales for every $1 spent.
Read case study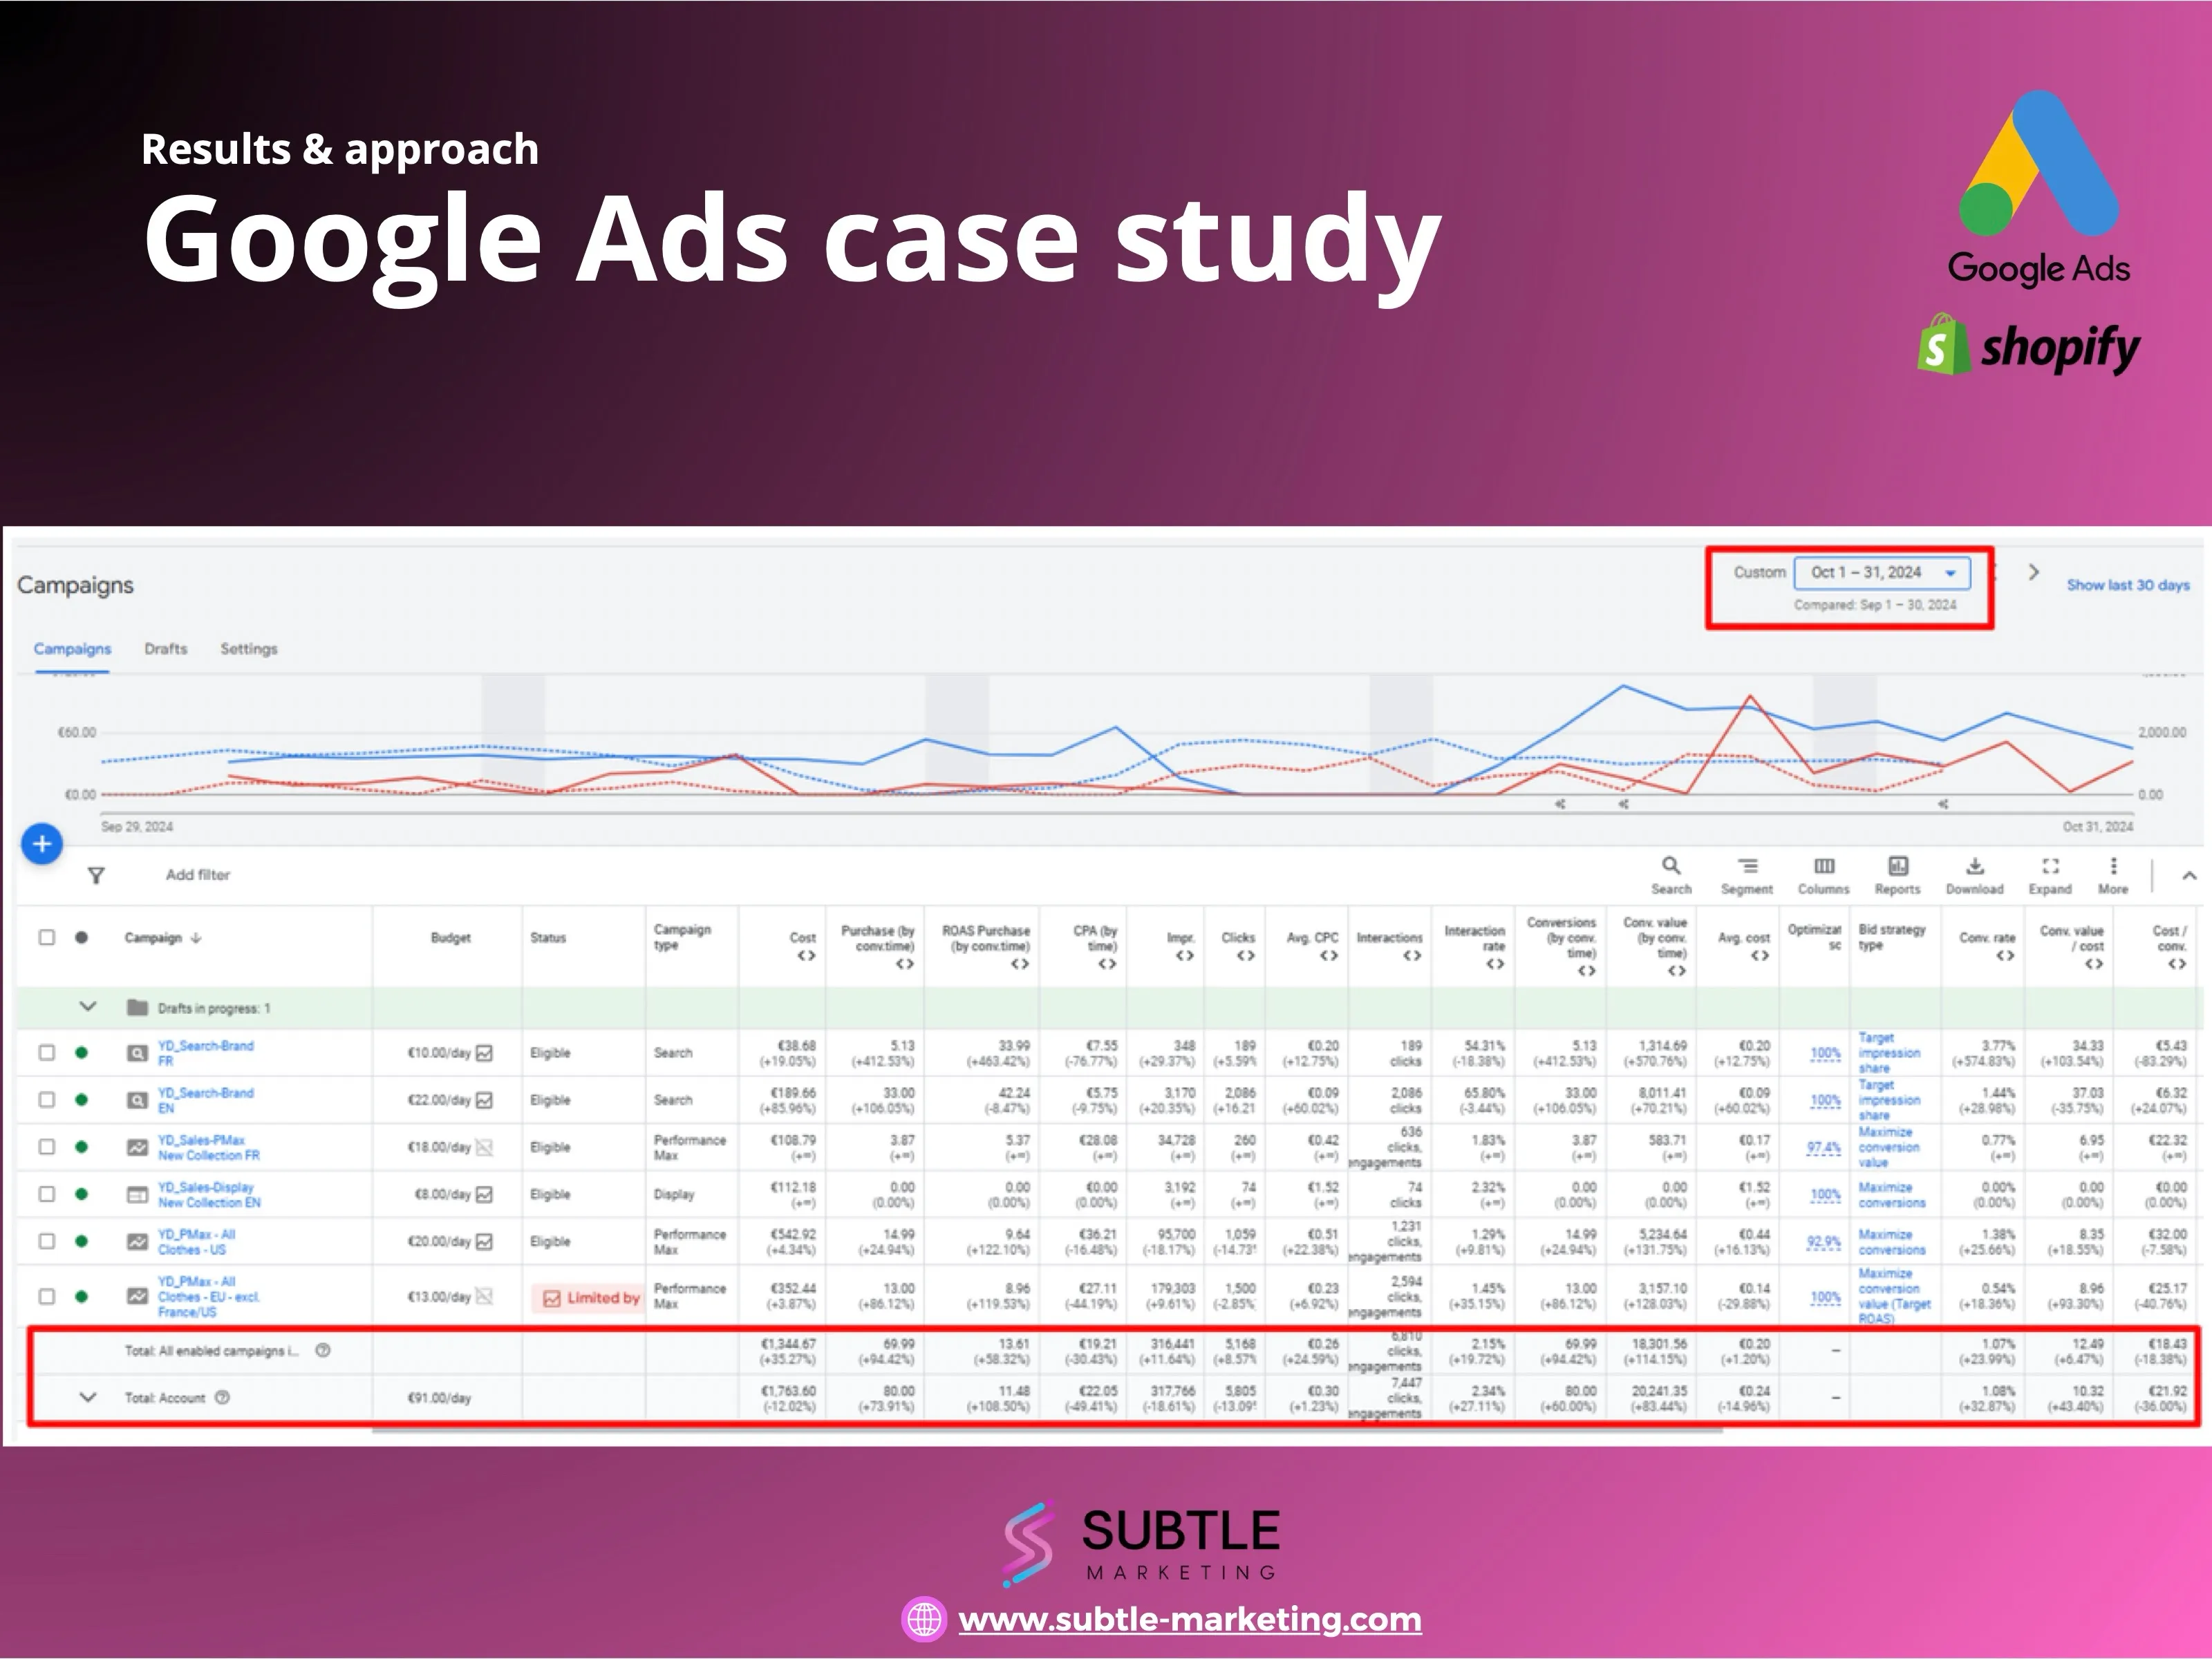
October vs September 2024, CPA down 49%
An authentic French women's clothing brand wanted more sales from Google Ads. We moved the account to Max Conversions and Target Impression Share strategies and, month over month, cut cost per purchase by 49% while revenue rose 26%.
Read case study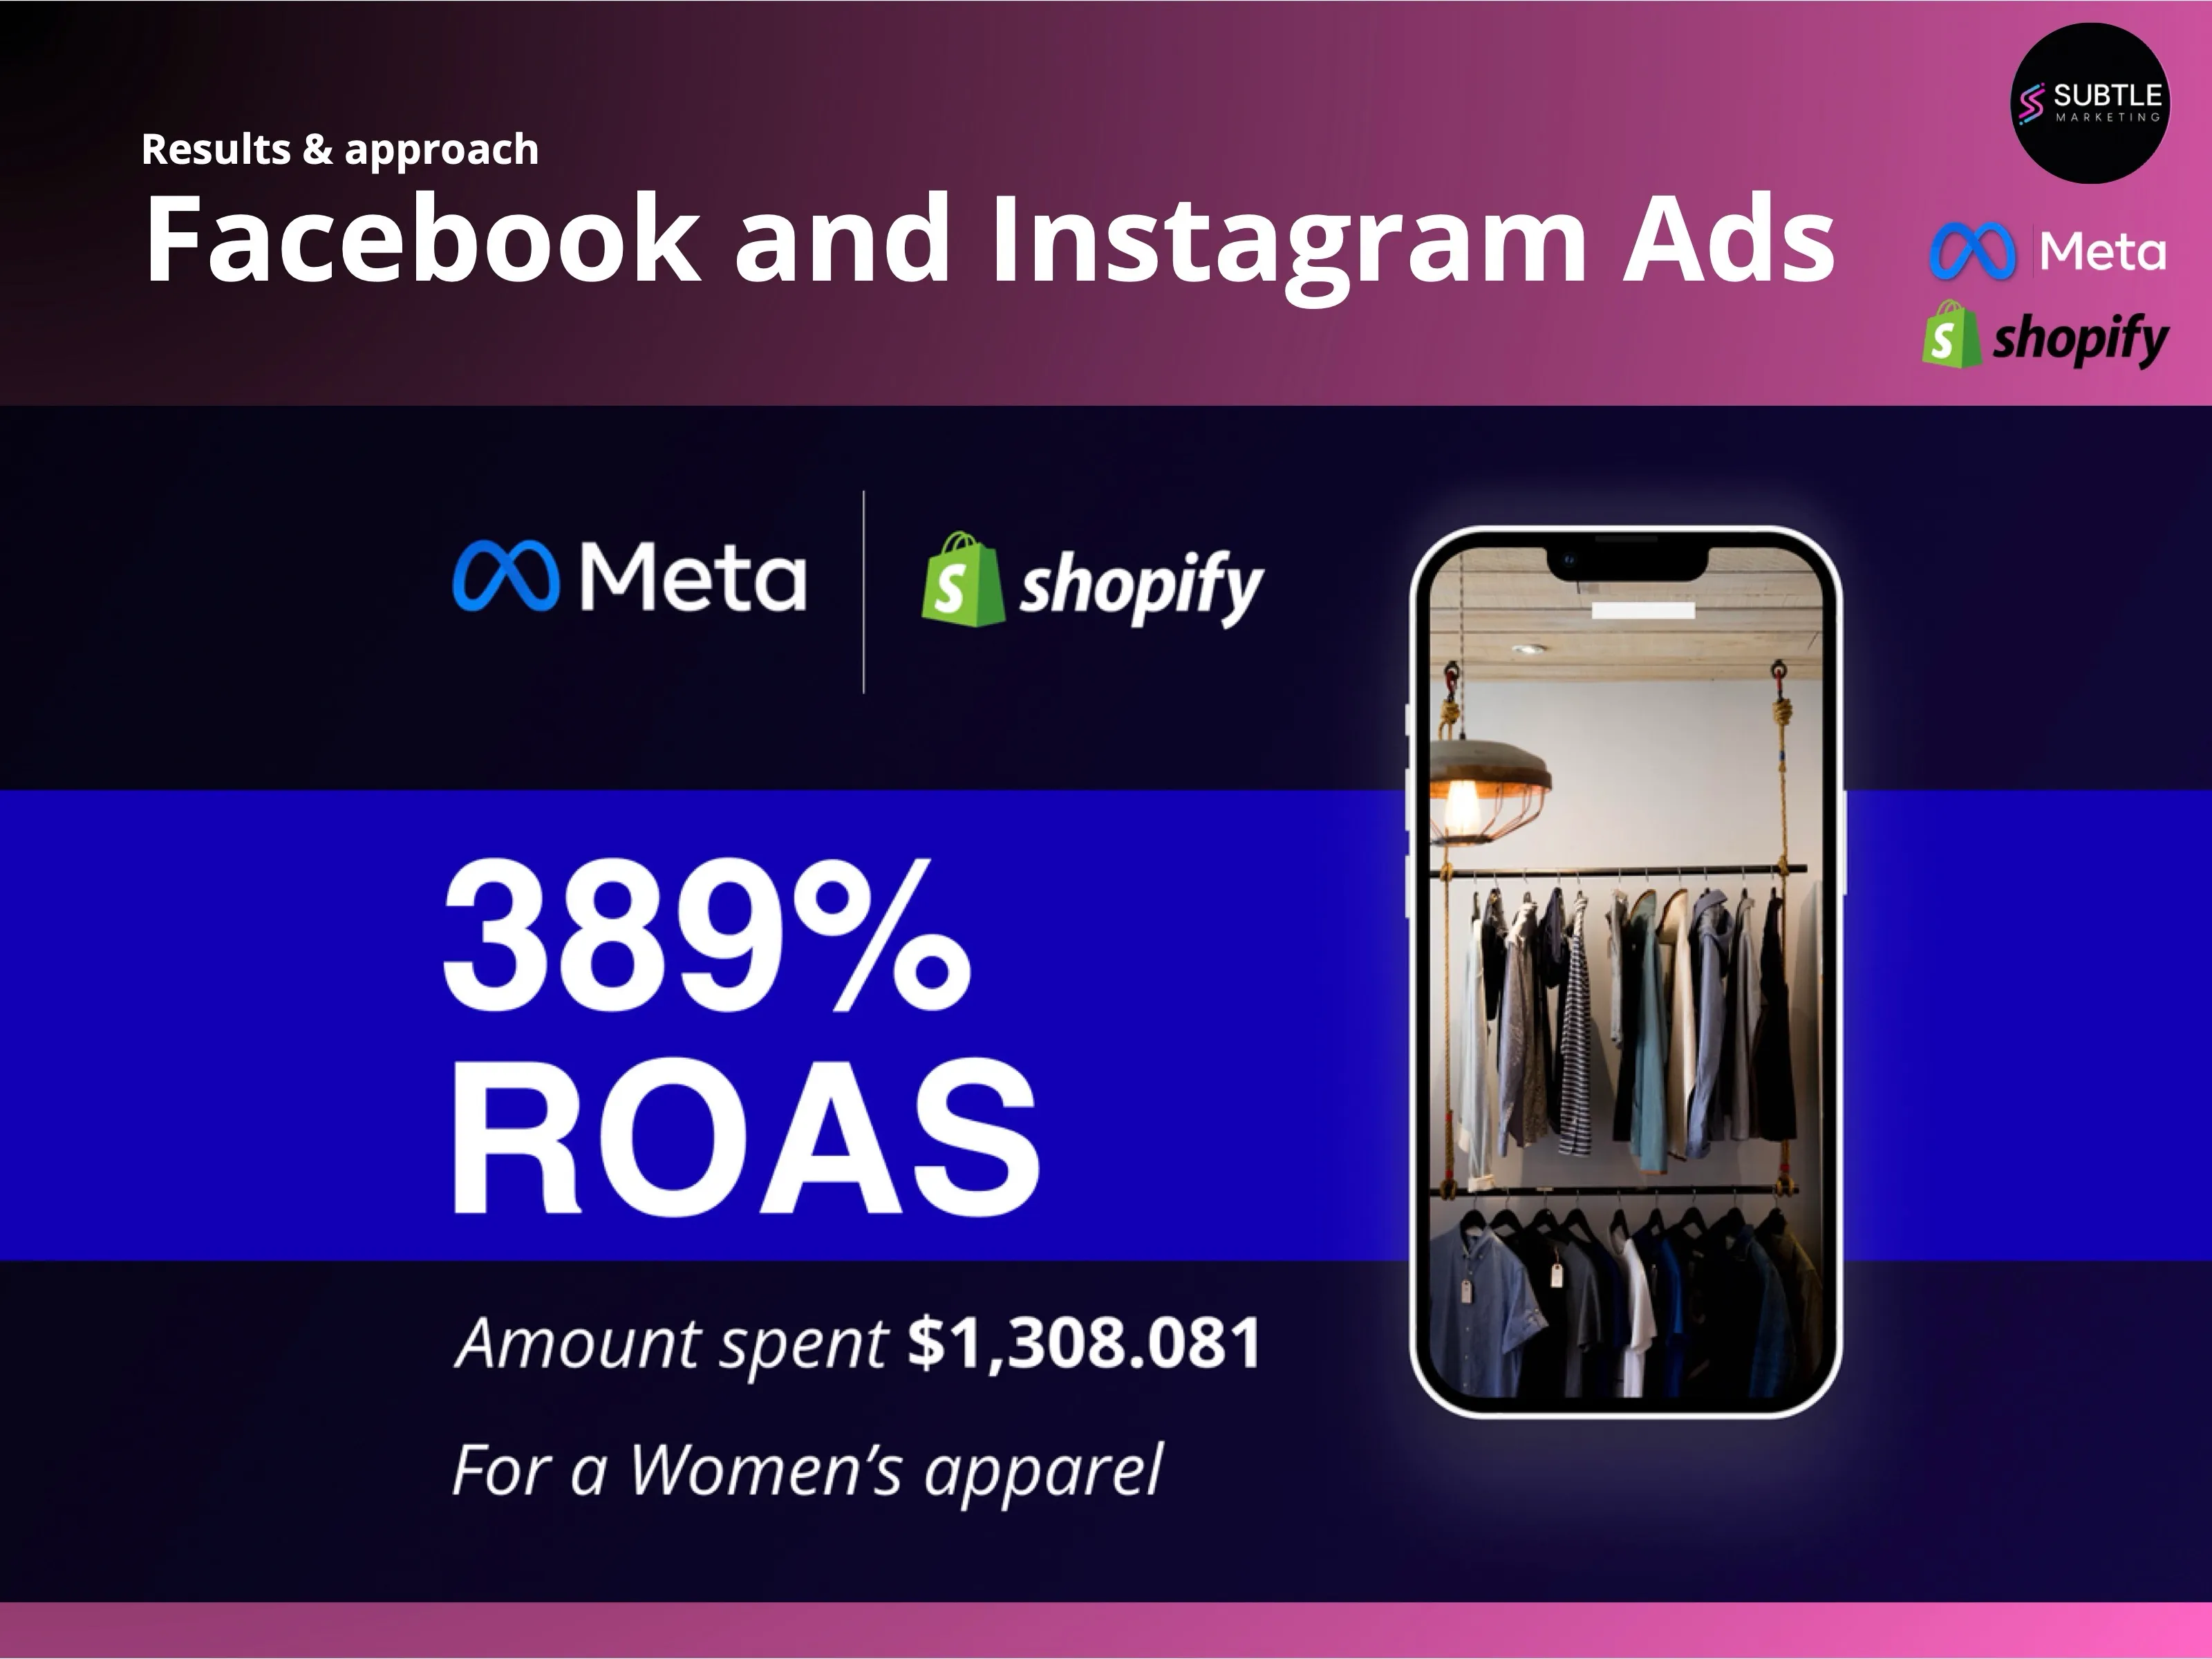
Blended return on ad spend
A Shopify women's apparel brand came to us with a 42% higher cost per conversion than target and campaigns that would not scale. Six months later the account was spending $26,849 a day at a 389% blended ROAS.
Read case study